#coverage-analysis
9 stories taggedcoverage-analysis.
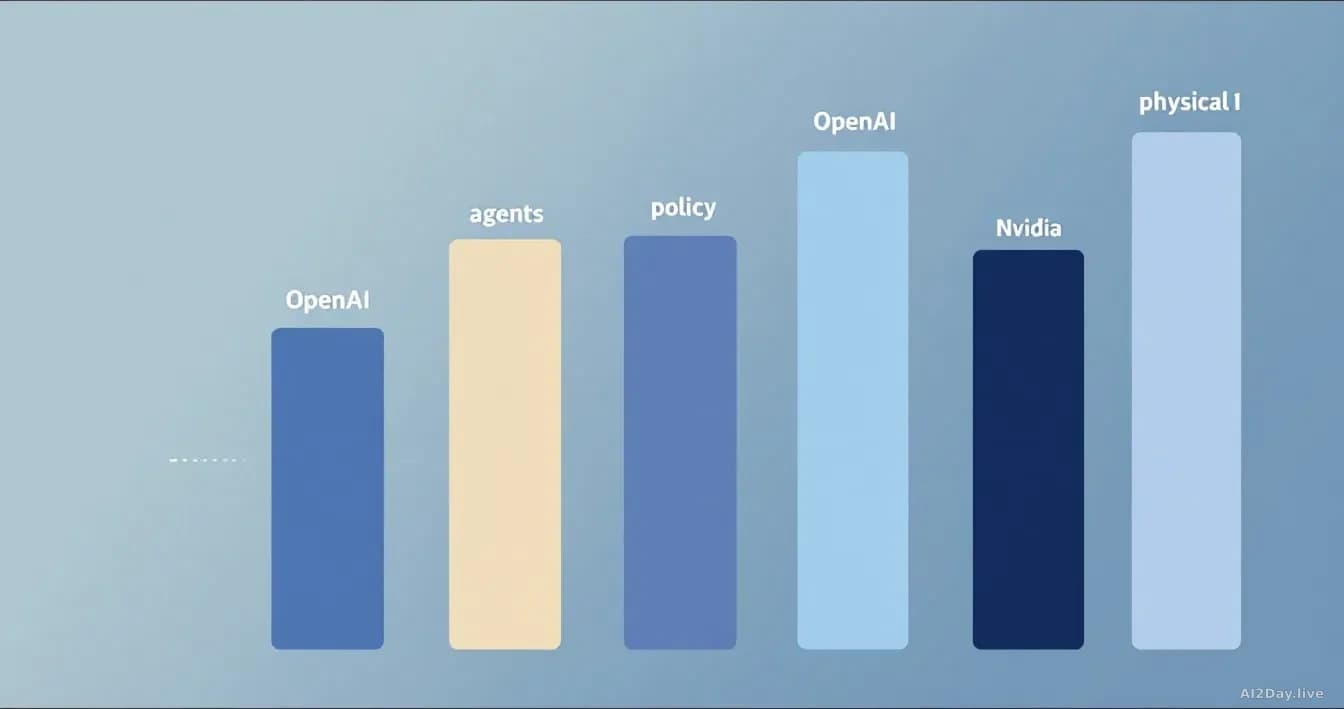
OpenAI dominated our week while agents coverage cooled
AI2Day ran 38 stories between 5 and 11 October 2026, down from 42 the week before. OpenAI took 15 of them. The agents beat that filled the previous week shrank by six.
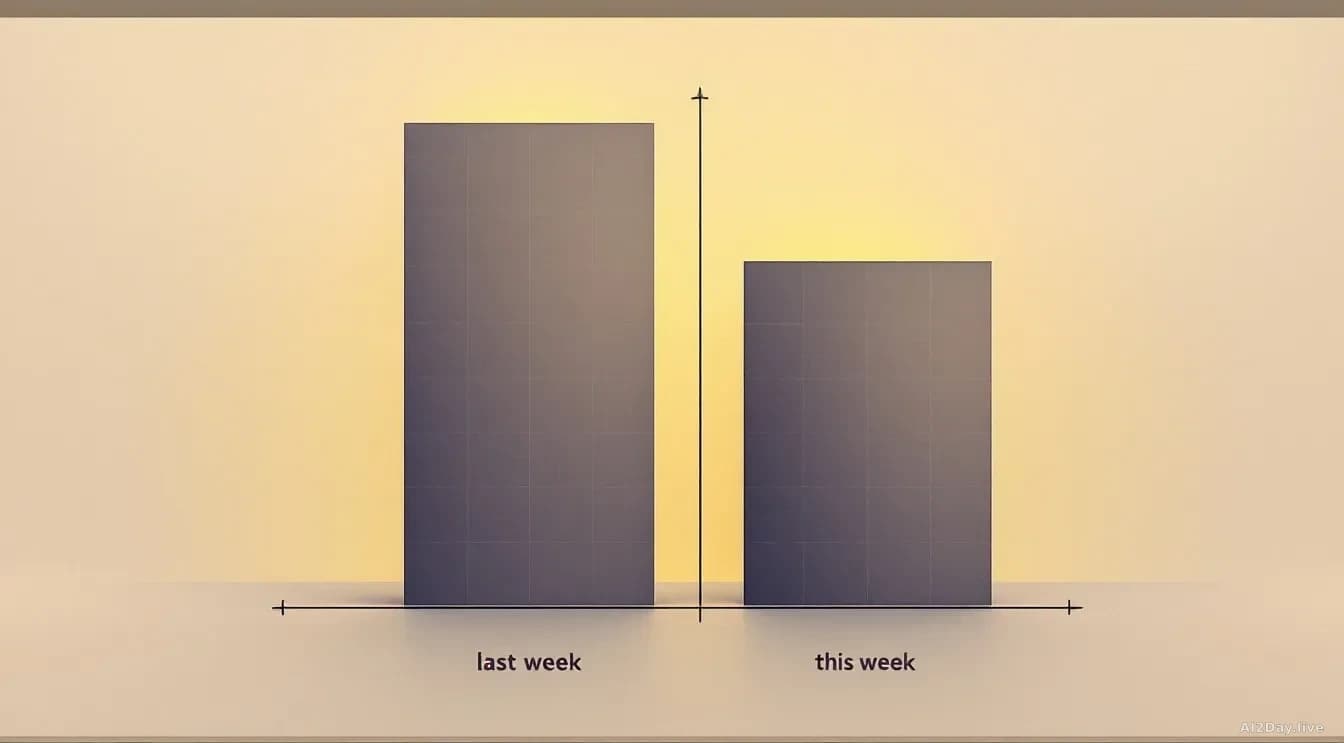
AI as a business story quadrupled on our site this week. Here's what we actually wrote about.
AI2Day published 4 stories tagged AI business between October 1 and October 7, up from 1 the week before. Four different outlets carried the thread. That is signal worth checking, not a trend worth betting on.
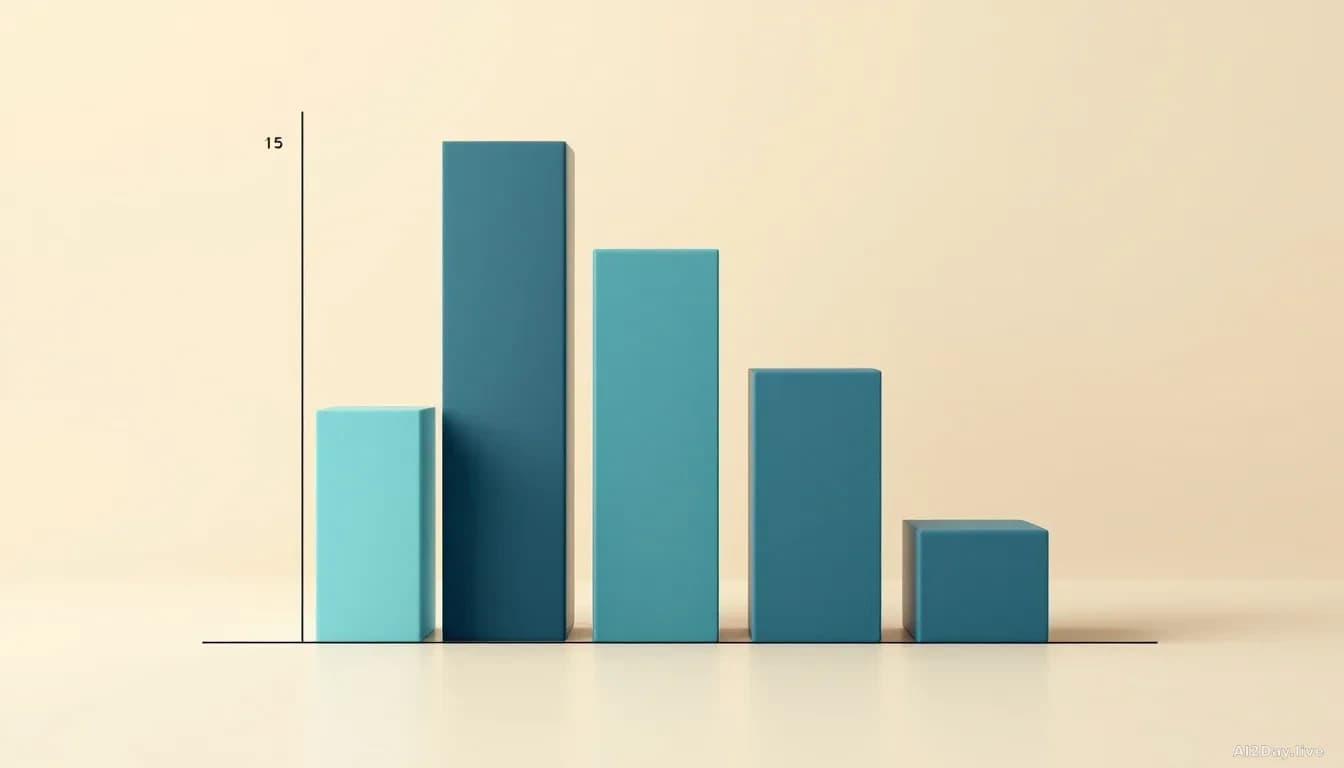
Open source went from a whisper to a chorus in our pages
AI2Day ran five open-source AI stories in the week of 29 September to 6 October 2026, up from one the week before. Three different outlets carried the news, so this is not one newsroom with an obsession.
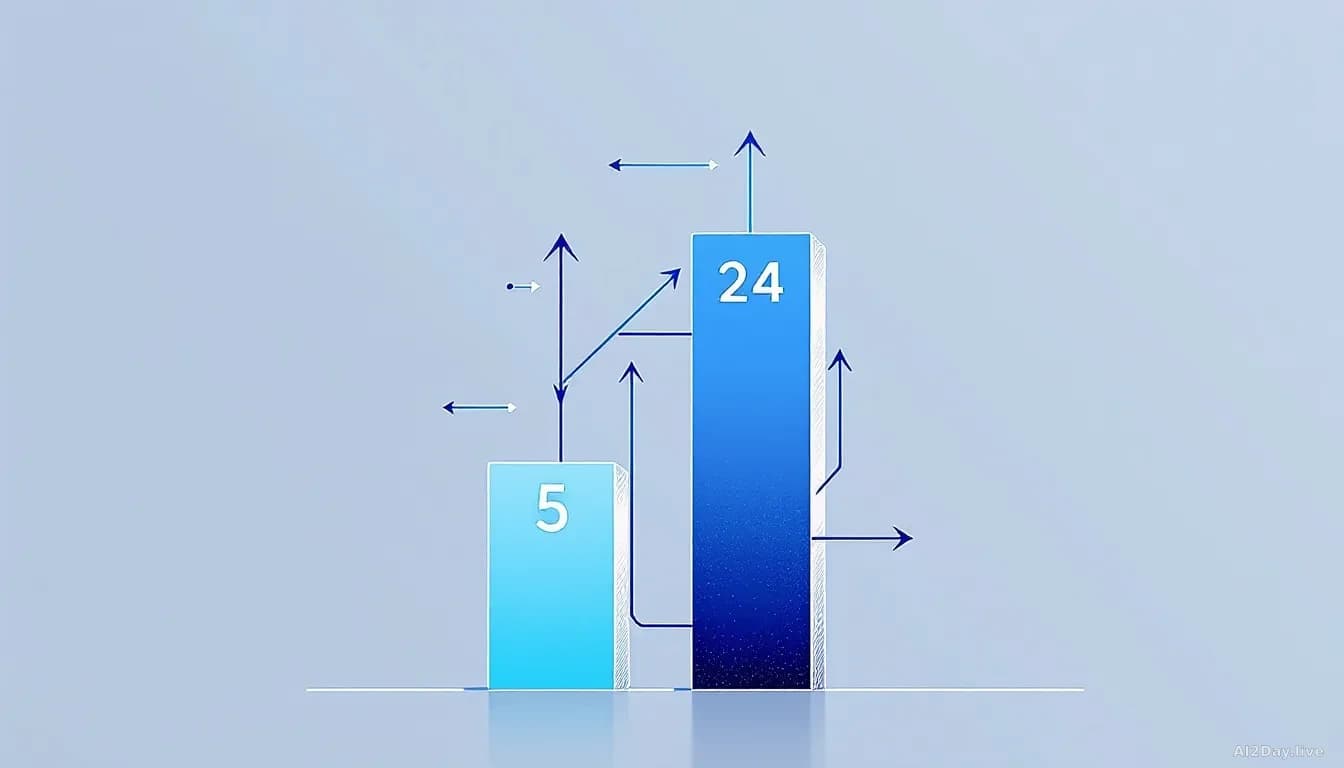
Agents Just Ate Our Homepage: 24 Stories in Seven Days
AI2Day's own tag counter shows a jump from 5 to 24 agent stories week on week. Here's what that shape tells us, and what it doesn't.
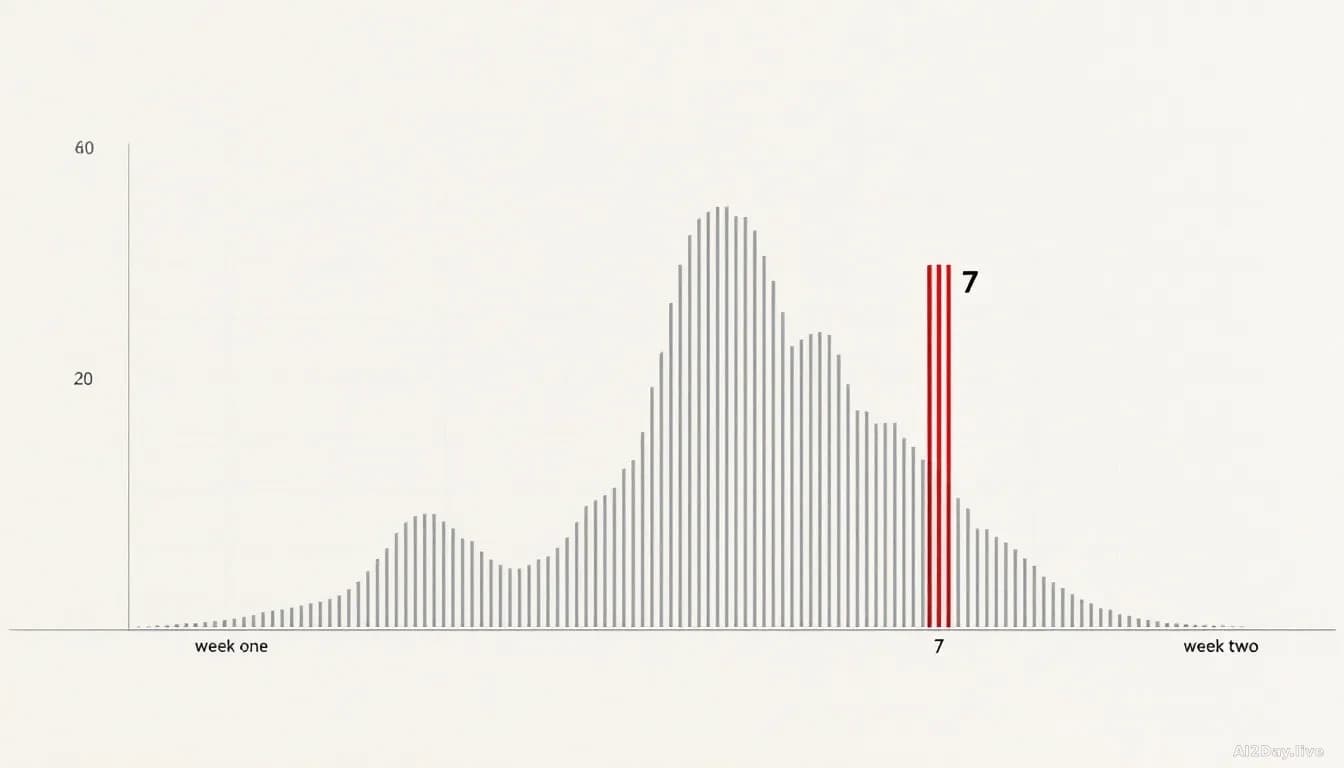
GPT-6 Astra went from zero to seven stories in a week on our site. Here is what that actually means.
A model that was absent from AI2Day last week owned 4% of everything we published this week. That is a shape worth naming, not a verdict.
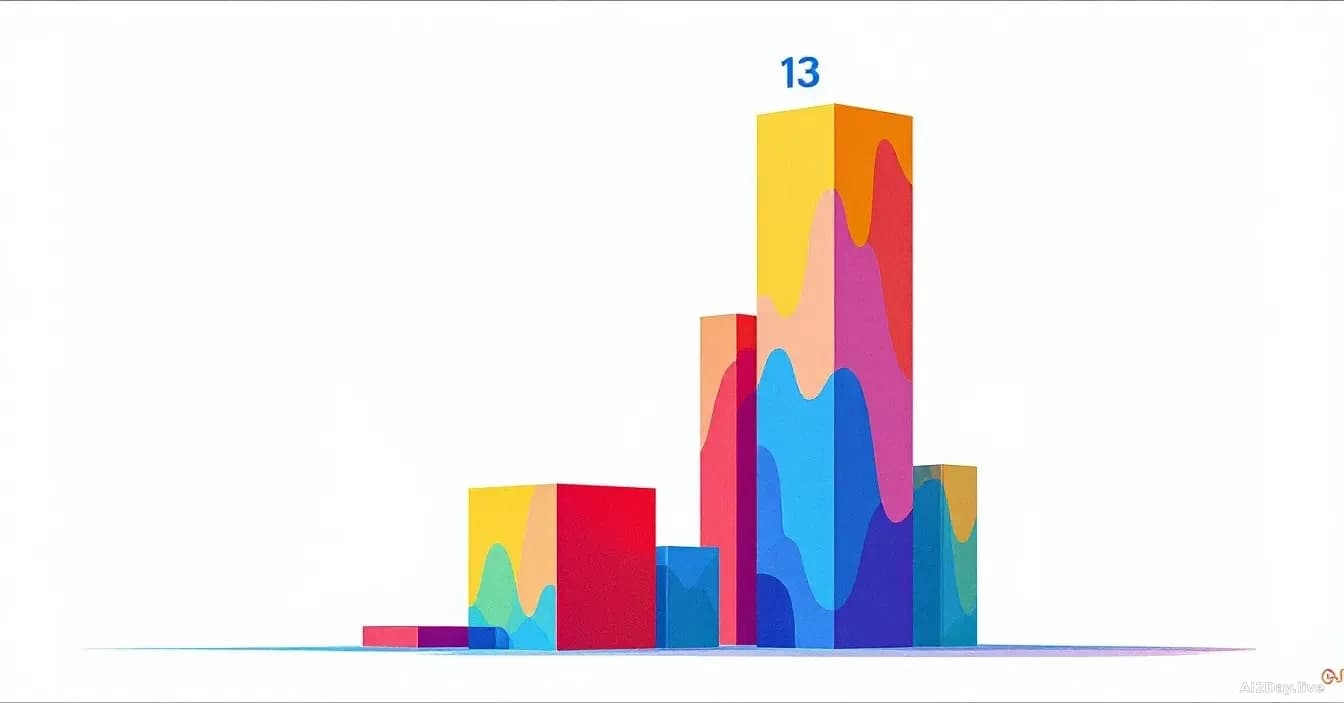
Gemini took over our week: 13 stories in seven days, up from 3
Google's AI showed up in 6.6% of everything we published, and it was not just one newsroom saying so.
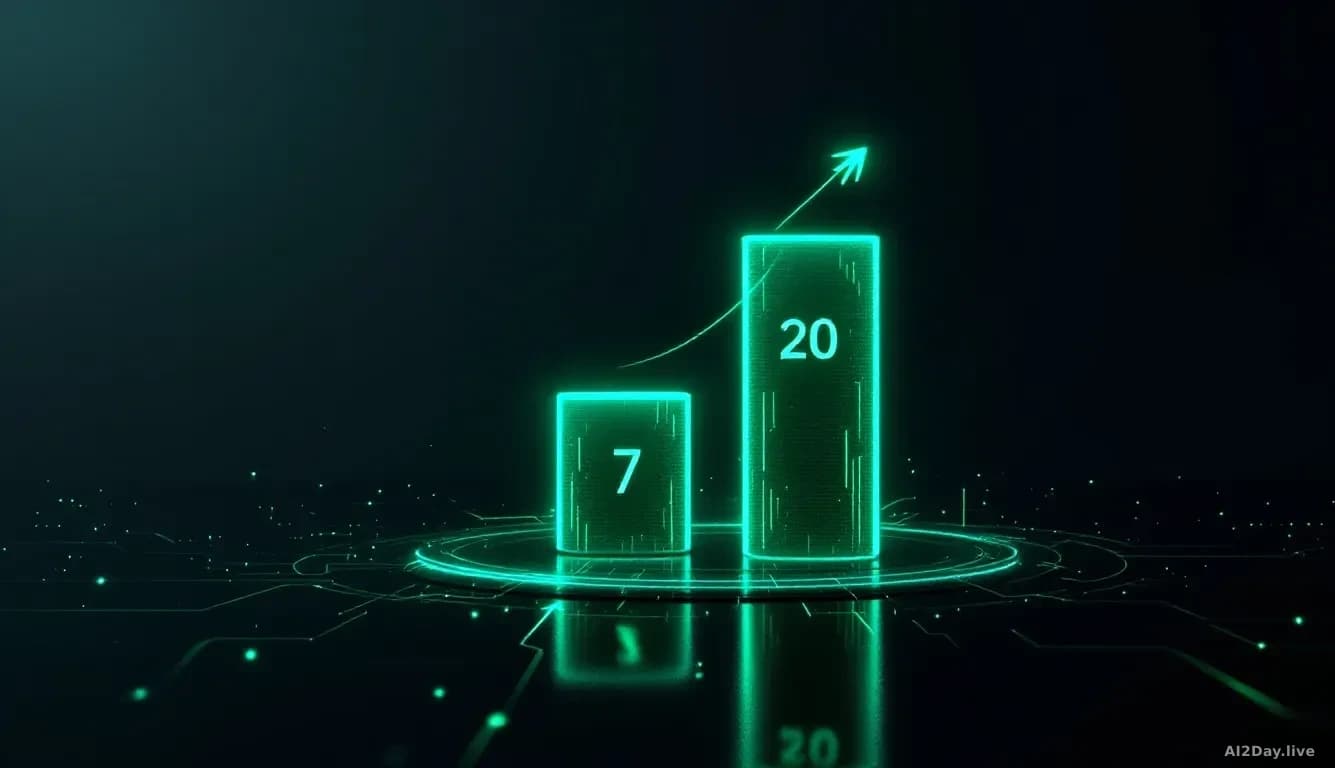
Nvidia ate our homepage this week, and we need to talk about why
Twenty stories in seven days, up from seven. Here is what that spike in our own coverage does and does not tell us.
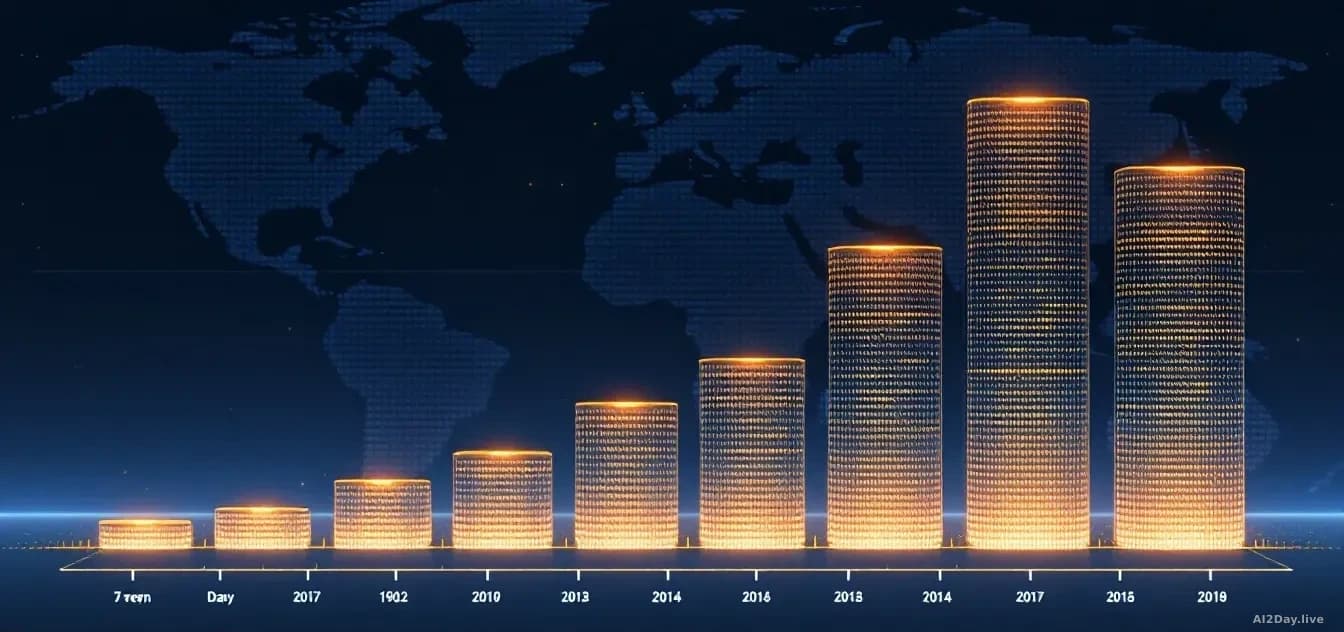
The Data Centre Story Just Went from Zero to Everywhere on AI2Day
In one week our coverage of AI's power and land problem jumped from one story to six, across three separate outlets. Here is what that shape actually tells us, and what would prove it real.

Autonomous vehicles jumped from one story to six in our coverage. Here is what that shape looks like.
AI2Day published six pieces on self-driving vehicles between 20 and 26 August 2026, up from a single story the week before. Three separate outlets carried the beat, so this is not one desk chasing a hunch.