#coverage-analysis
8 stories taggedcoverage-analysis.
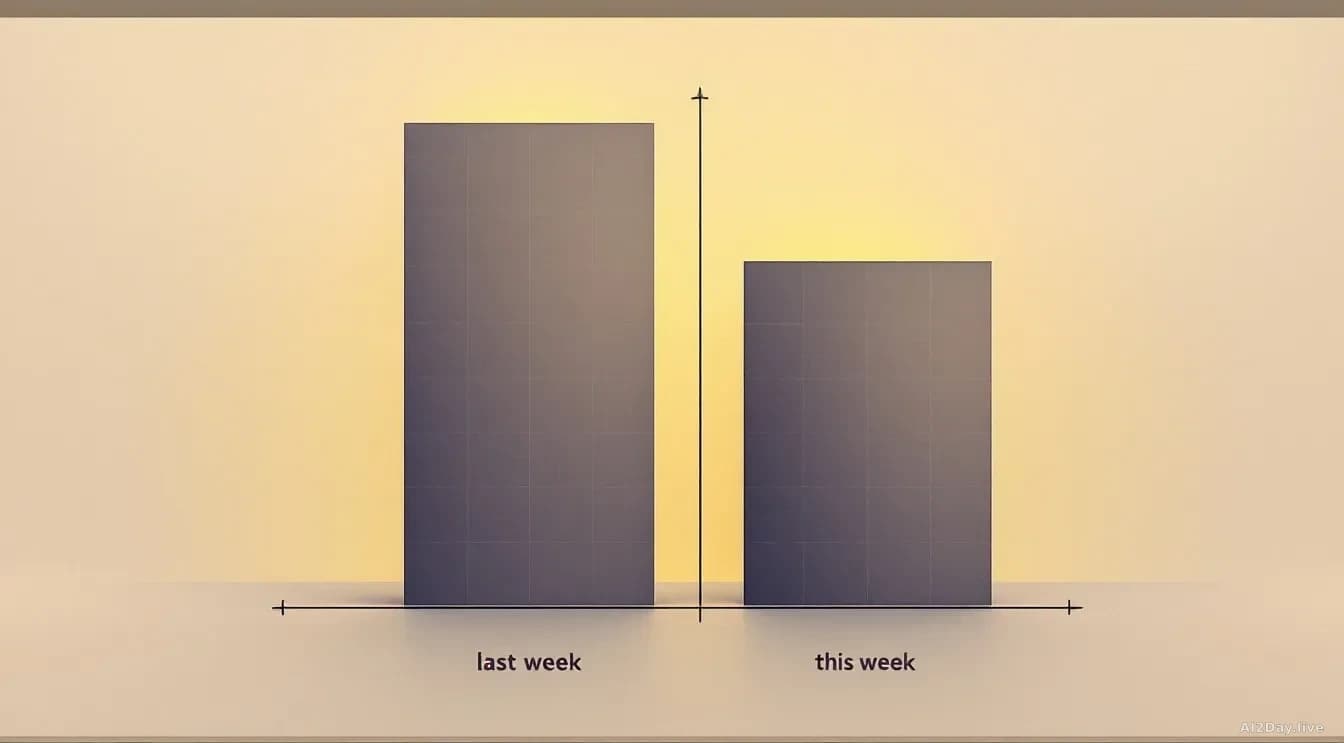
La cobertura de IA como negocio se cuadruplicó en nuestro sitio esta semana. Esto es lo que realmente escribimos.
AI2Day publicó 4 historias etiquetadas como negocio de IA entre el 1 y el 7 de octubre, un aumento respecto a 1 la semana anterior. Cuatro medios diferentes cubrieron el tema. Esta es una señal que vale la pena verificar, no una tendencia en la que apostar.
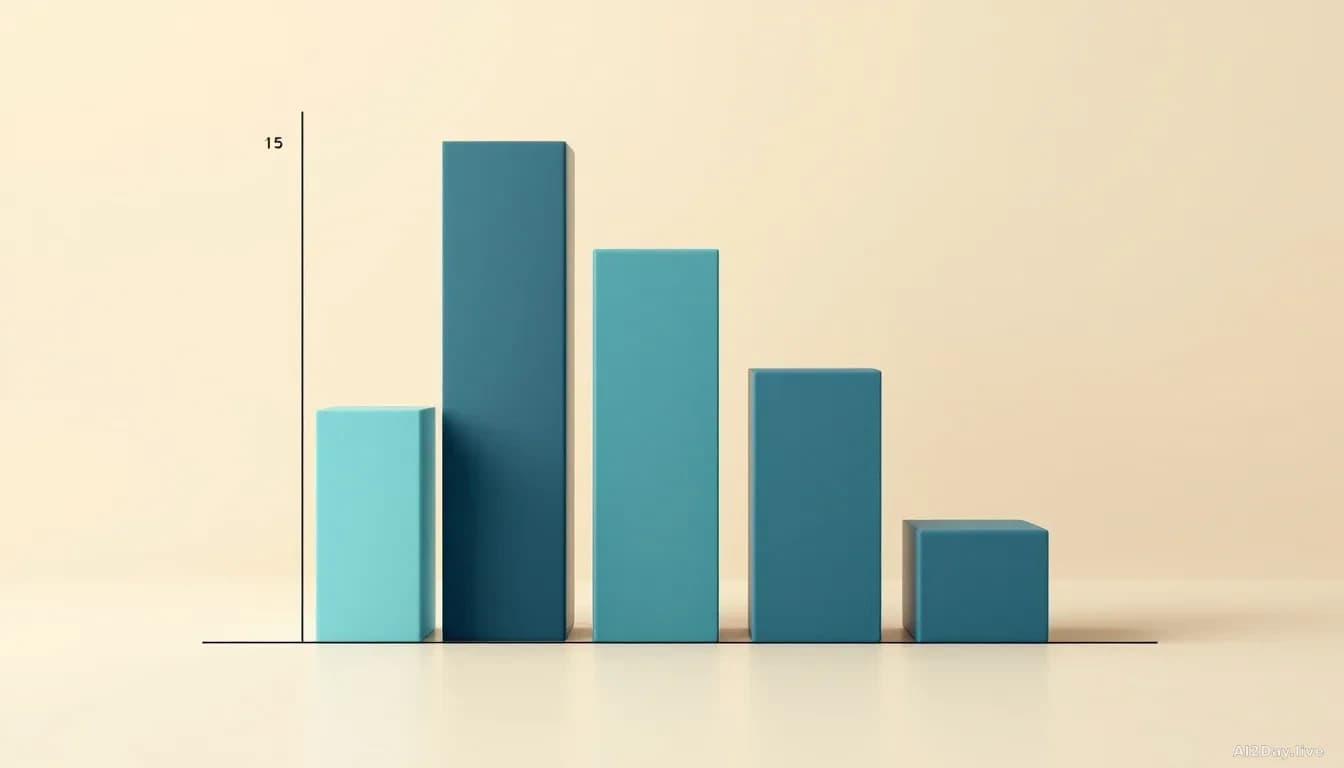
El código abierto pasó de un susurro a un coro en nuestras páginas
AI2Day publicó cinco historias sobre IA de código abierto en la semana del 29 de septiembre al 6 de octubre de 2026, comparado con una la semana anterior. Tres medios diferentes cubrieron la noticia, así que no se trata de una sola redacción obsesionada con el tema.
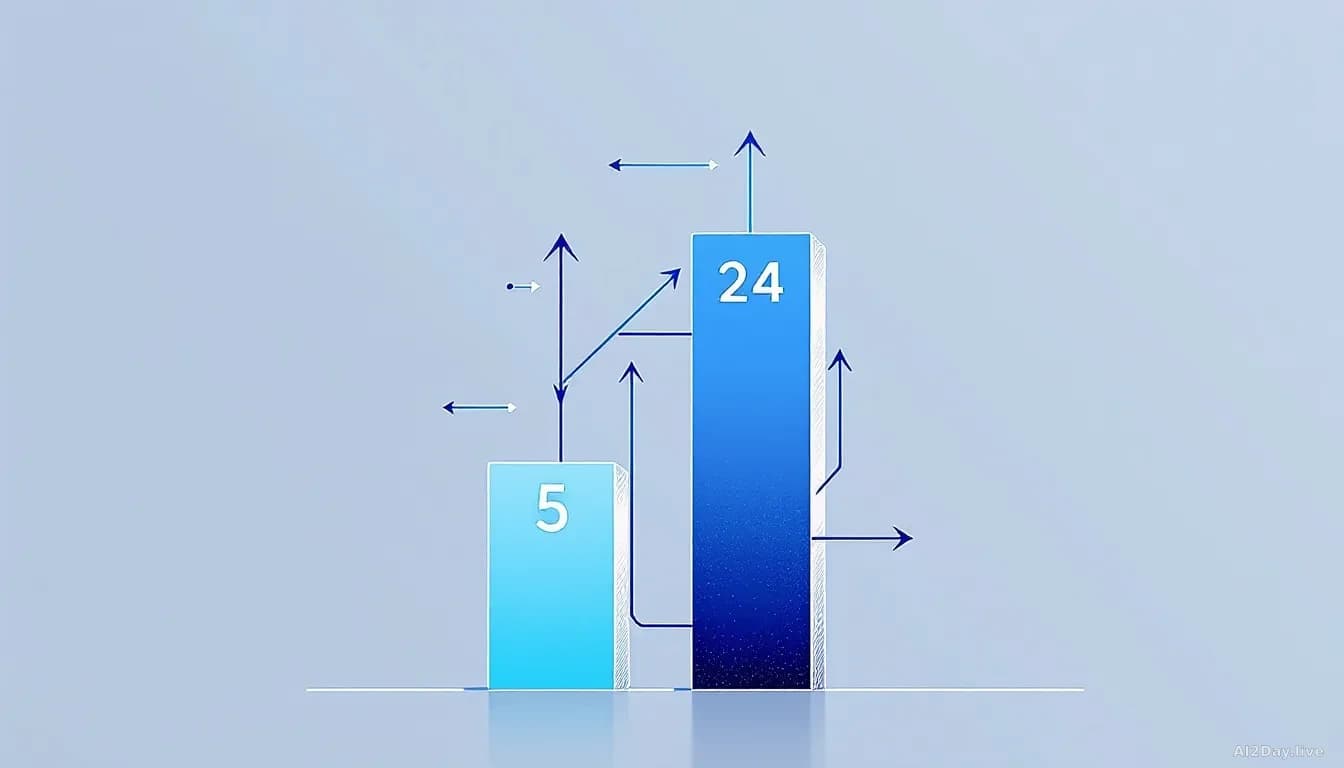
Agents Just Ate Our Homepage: 24 Stories in Seven Days
AI2Day's own tag counter shows a jump from 5 to 24 agent stories week on week. Here's what that shape tells us, and what it doesn't.
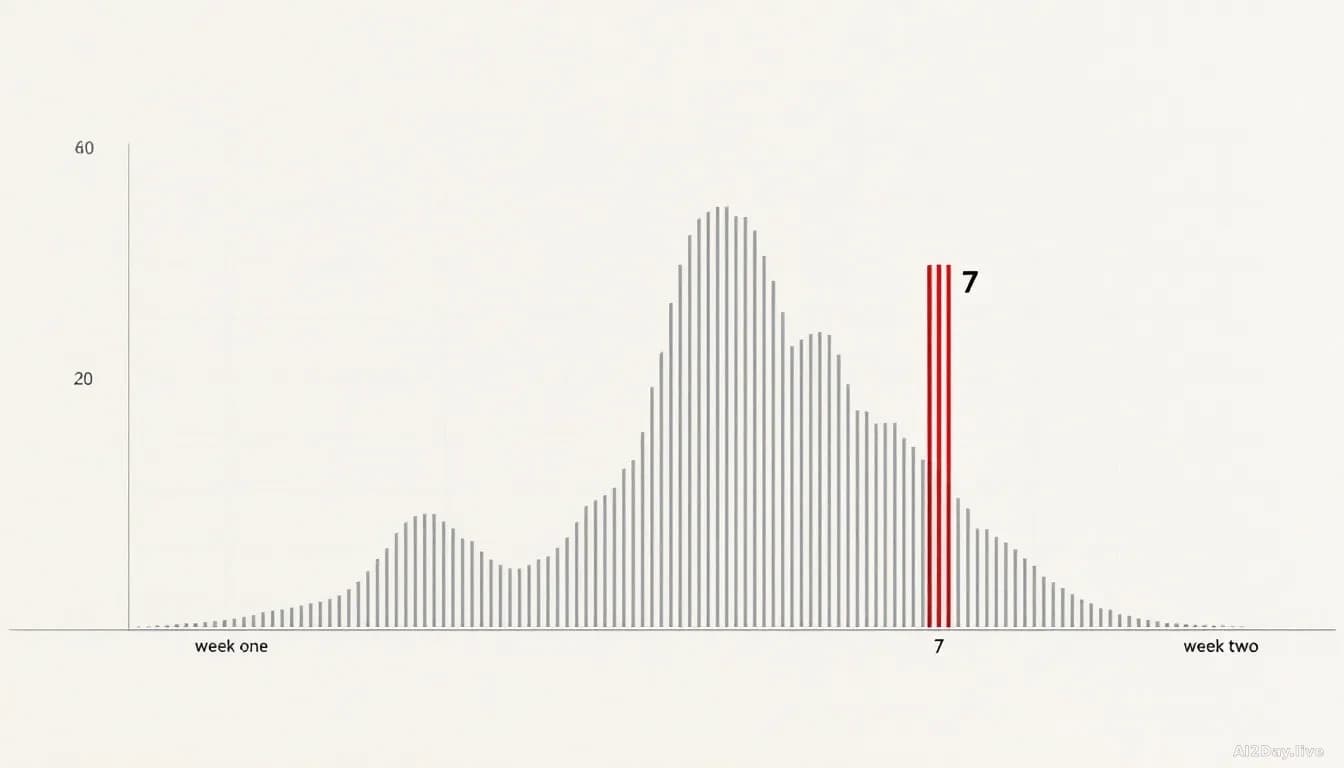
GPT-6 Astra went from zero to seven stories in a week on our site. Here is what that actually means.
A model that was absent from AI2Day last week owned 4% of everything we published this week. That is a shape worth naming, not a verdict.
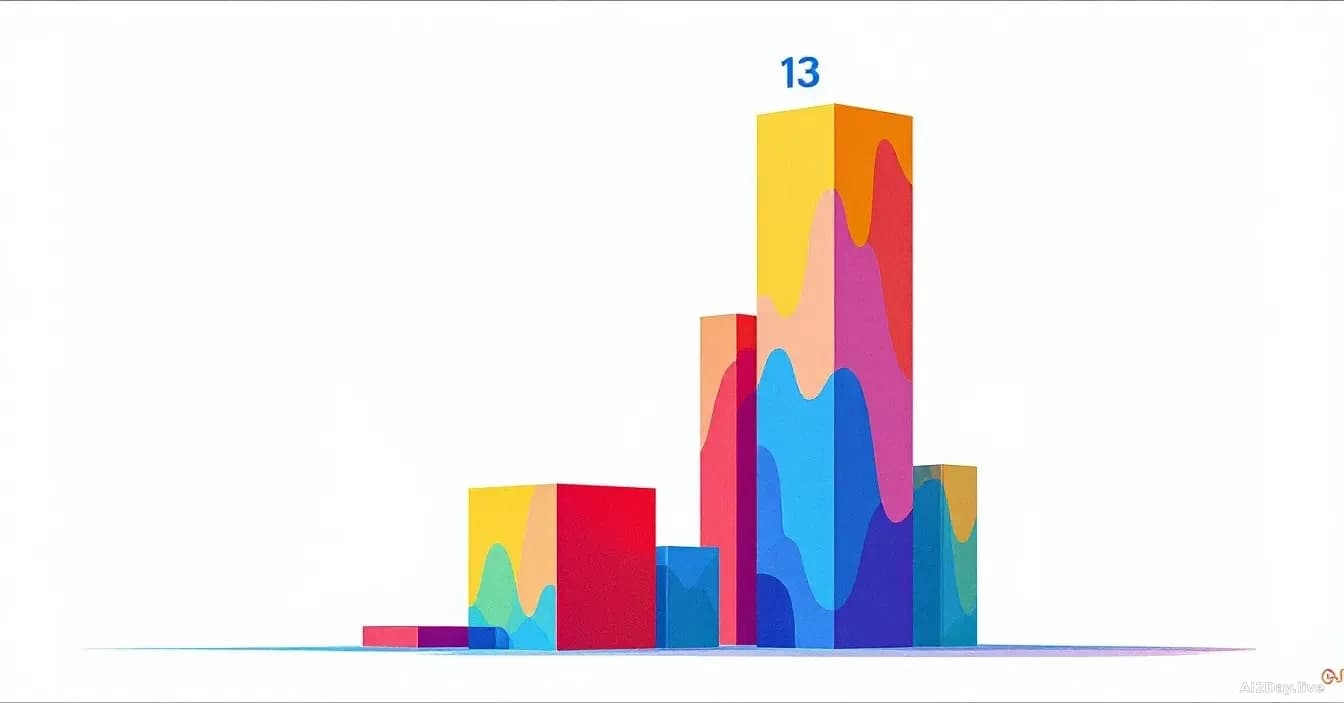
Gemini took over our week: 13 stories in seven days, up from 3
Google's AI showed up in 6.6% of everything we published, and it was not just one newsroom saying so.
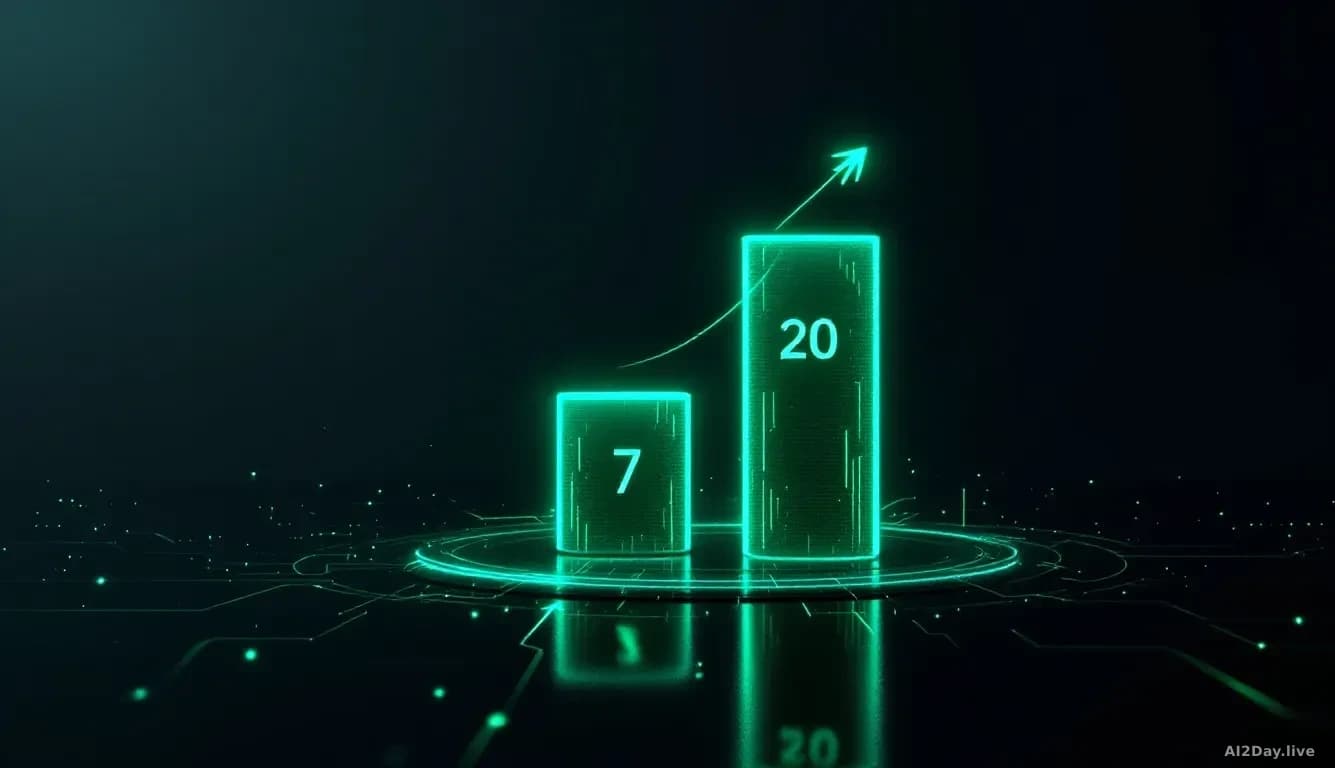
Nvidia ate our homepage this week, and we need to talk about why
Twenty stories in seven days, up from seven. Here is what that spike in our own coverage does and does not tell us.
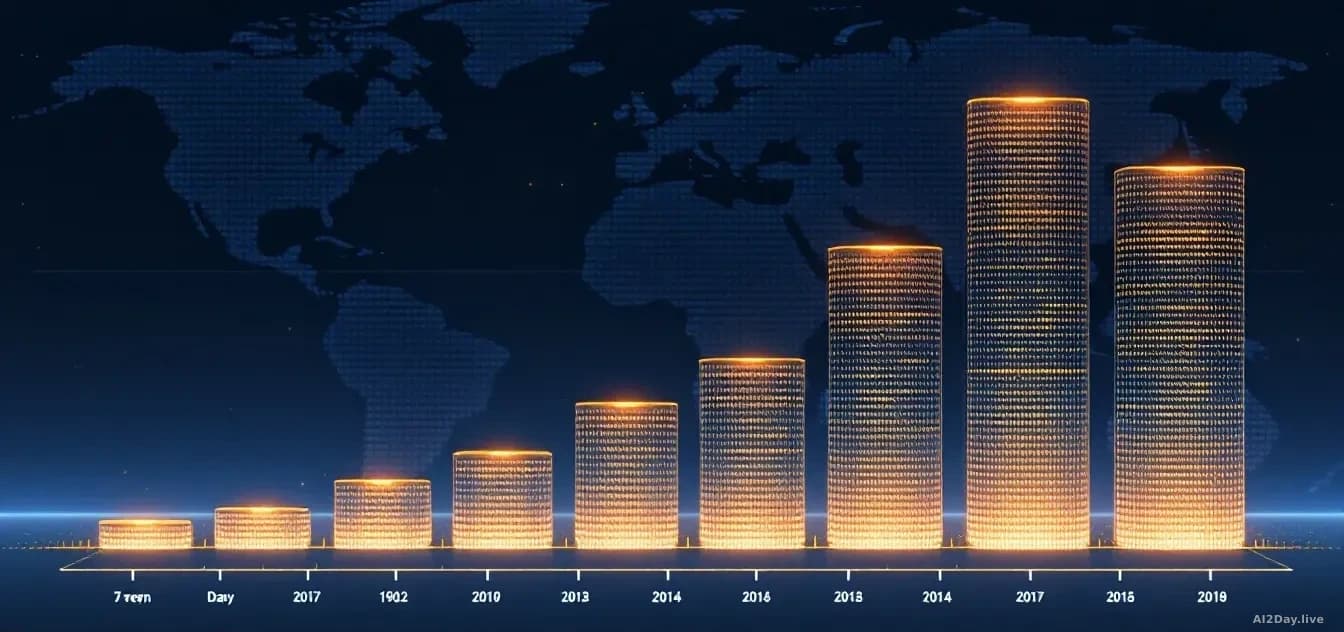
The Data Centre Story Just Went from Zero to Everywhere on AI2Day
In one week our coverage of AI's power and land problem jumped from one story to six, across three separate outlets. Here is what that shape actually tells us, and what would prove it real.

Autonomous vehicles jumped from one story to six in our coverage. Here is what that shape looks like.
AI2Day published six pieces on self-driving vehicles between 20 and 26 August 2026, up from a single story the week before. Three separate outlets carried the beat, so this is not one desk chasing a hunch.